219 - 1D Bridge Cross-Section Plotting with Deck/Pier Overlay
HEC-RAS 1D bridges use four cross-sections:
| Section | Location | Description |
|---|---|---|
| 4 | Upstream approach | Regular XS upstream of bridge embankment |
| 3 | Upstream face | Ground profile at upstream bridge opening |
| 2 | Downstream face | Ground profile at downstream bridge opening |
| 1 | Downstream approach | Regular XS downstream of bridge embankment |
This notebook demonstrates how to plot all four sections aligned at the channel centerline, with deck and pier overlays matching HEC-RAS conventions.
Sections 2 and 3 are read via GeomBridge.get_bridge_opening_xs(), which
returns explicit BR U / BR D data when present, or falls back to the
adjacent approach cross-section.
# =============================================================================
# DEVELOPMENT MODE TOGGLE
# =============================================================================
USE_LOCAL_SOURCE = True

if USE_LOCAL_SOURCE:
    import sys
    from pathlib import Path
    local_path = str(Path.cwd().parent)
    if local_path not in sys.path:
        sys.path.insert(0, local_path)
    print(f"LOCAL SOURCE MODE: Loading from {local_path}/ras_commander")
else:
    print("PIP PACKAGE MODE: Loading installed ras-commander")
LOCAL SOURCE MODE: Loading from G:\GH\ras-commander/ras_commander
from pathlib import Path
import matplotlib.pyplot as plt
import matplotlib.patches as mpatches
import numpy as np
import pandas as pd

from ras_commander import RasExamples
from ras_commander.geom import GeomBridge
Extract example project and select a bridge
import re

project_path = RasExamples.extract_project("Bridge Hydraulics", suffix="nb219")
geom_file = sorted(
    p for p in Path(project_path).iterdir()
    if p.is_file() and re.search(r"\.g\d\d$", p.name.lower())
)[0]

bridges = GeomBridge.get_bridges(geom_file)
print(f"Geometry file: {geom_file.name}")
print(f"Found {len(bridges)} bridge(s):")
bridges[["River", "Reach", "RS", "NumDecks", "NumPiers", "DeckWidth"]]
2026-05-20 14:00:02 - ras_commander.RasExamples - INFO - Found zip file: C:\Users\bill\AppData\Local\ras-commander\examples\Example_Projects_7_0.zip


2026-05-20 14:00:02 - ras_commander.RasExamples - INFO - Loading project data from CSV...


2026-05-20 14:00:02 - ras_commander.RasExamples - INFO - Loaded 67 projects from CSV.


2026-05-20 14:00:02 - ras_commander.RasExamples - INFO - ----- RasExamples Extracting Project -----


2026-05-20 14:00:02 - ras_commander.RasExamples - INFO - Extracting project 'Bridge Hydraulics' as 'Bridge Hydraulics_nb219'


2026-05-20 14:00:02 - ras_commander.RasExamples - INFO - Successfully extracted project 'Bridge Hydraulics' to G:\GH\ras-commander\examples\example_projects\Bridge Hydraulics_nb219


Geometry file: beaver.g01
Found 1 bridge(s):
| River | Reach | RS | NumDecks | NumPiers | DeckWidth | |
|---|---|---|---|---|---|---|
| 0 | Beaver Creek | Kentwood | 5.4 | 30 | 9 | 2.6 |
row = bridges.iloc[0]
river, reach, rs = row["River"], row["Reach"], str(row["RS"])

deck_df = GeomBridge.get_deck(geom_file, river, reach, rs)
piers_df = GeomBridge.get_piers(geom_file, river, reach, rs)
xs_up_inside = GeomBridge.get_bridge_opening_xs(geom_file, river, reach, rs, section="upstream")
xs_dn_inside = GeomBridge.get_bridge_opening_xs(geom_file, river, reach, rs, section="downstream")

print(f"Bridge: {river} / {reach} / RS {rs}")
print(f"  Deck points: {len(deck_df)} ({deck_df['Location'].unique().tolist()})")
print(f"  Piers: {len(piers_df)}")
print(f"  Section 3 (upstream face): {len(xs_up_inside)} pts [source: {xs_up_inside['Source'].iloc[0]}]")
print(f"  Section 2 (downstream face): {len(xs_dn_inside)} pts [source: {xs_dn_inside['Source'].iloc[0]}]")
2026-05-20 14:00:02 - ras_commander.geom.GeomBridge - INFO - Extracted deck geometry for Beaver Creek/Kentwood/RS 5.4: 6 points


2026-05-20 14:00:02 - ras_commander.geom.GeomBridge - INFO - Extracted 9 piers for Beaver Creek/Kentwood/RS 5.4


2026-05-20 14:00:02 - ras_commander.geom.GeomBridge - INFO - Extracted upstream bridge opening XS (66 pts) for Beaver Creek/Kentwood/RS 5.4 from adjacent approach XS


2026-05-20 14:00:02 - ras_commander.geom.GeomBridge - INFO - Extracted downstream bridge opening XS (63 pts) for Beaver Creek/Kentwood/RS 5.4 from adjacent approach XS


Bridge: Beaver Creek / Kentwood / RS 5.4
  Deck points: 6 (['upstream'])
  Piers: 9
  Section 3 (upstream face): 66 pts [source: approach_xs]
  Section 2 (downstream face): 63 pts [source: approach_xs]
Plot function: plot_1d_bridge_xs
The function handles the key challenge of 1D bridges: each of the four cross-sections may have different station ranges because they were hand-drawn independently. We align them at the channel centerline using bank stations, so the overbank and channel features line up visually.
def _interp_ground_at(xs_df, stations):
    """Interpolate ground elevation at arbitrary stations from an XS DataFrame."""
    return np.interp(stations, xs_df["Station"].values, xs_df["Elevation"].values)


def plot_1d_bridge_xs(
    geom_file,
    river,
    reach,
    rs,
    channel_width_factor=1.5,
    figsize=(14, 8),
):
    """
    Plot all 4 cross-sections at a 1D bridge with deck and pier overlays.

    Parameters
    ----------
    geom_file : Path
        HEC-RAS geometry file (.g##).
    river, reach, rs : str
        Bridge location identifiers.
    channel_width_factor : float
        How much wider than the channel opening to show (1.5 = 50% padding).
    figsize : tuple
        Figure size.

    Returns
    -------
    fig, axes : matplotlib Figure and array of two Axes (upstream, downstream).
    """
    deck_df = GeomBridge.get_deck(geom_file, river, reach, rs)
    piers_df = GeomBridge.get_piers(geom_file, river, reach, rs)
    xs_sec3 = GeomBridge.get_bridge_opening_xs(geom_file, river, reach, rs, section="upstream")
    xs_sec2 = GeomBridge.get_bridge_opening_xs(geom_file, river, reach, rs, section="downstream")

    up_deck = deck_df[deck_df["Location"] == "upstream"]
    dn_deck = deck_df[deck_df["Location"] == "downstream"]
    if dn_deck.empty:
        dn_deck = up_deck

    # --- Channel-center alignment ---
    # The opening is where LowChord is elevated (not a placeholder value near overbank ground).
    all_lc = up_deck["LowChord"].values
    all_sta = up_deck["Station"].values
    if len(all_lc) >= 2:
        lc_max = all_lc.max()
        opening_mask = all_lc > (all_lc.min() + 0.1 * (lc_max - all_lc.min()))
        opening_stations = all_sta[opening_mask]
        if len(opening_stations) >= 2:
            channel_center = (opening_stations.min() + opening_stations.max()) / 2
        else:
            channel_center = all_sta.mean()
    else:
        channel_center = all_sta.mean()

    if len(all_sta) >= 2:
        opening_width = (opening_stations.max() - opening_stations.min()
                         if len(opening_stations) >= 2
                         else all_sta.max() - all_sta.min())
    else:
        opening_width = 200
    half_view = opening_width * channel_width_factor
    view_left = channel_center - half_view
    view_right = channel_center + half_view

    fig, axes = plt.subplots(1, 2, figsize=figsize, sharey=True)
    fig.suptitle(f"1D Bridge: {river} / {reach} / RS {rs}", fontsize=13, fontweight="bold")

    sections = [
        (axes[0], "Upstream Face (Section 3)", xs_sec3, up_deck,
         "UpstreamStation", "UpstreamWidths", "UpstreamElevations"),
        (axes[1], "Downstream Face (Section 2)", xs_sec2, dn_deck,
         "DownstreamStation", "DownstreamWidths", "DownstreamElevations"),
    ]

    elev_min_global = float("inf")
    elev_max_global = float("-inf")

    for ax, title, xs_df, face_deck, pier_sta_col, pier_w_col, pier_e_col in sections:
        xs_sta = xs_df["Station"].values
        xs_elev = xs_df["Elevation"].values

        # Earth fill below ground profile
        ax.fill_between(xs_sta, xs_elev, y2=0, color="burlywood", alpha=0.25, zorder=1)

        # Ground profile
        ax.plot(xs_sta, xs_elev,
                color="saddlebrown", linewidth=1.8, zorder=3, label="Ground")

        # Deck polygon — clip lower bound at ground elevation so no fill below grade
        d_sta = face_deck["Station"].values
        d_hi = face_deck["Elevation"].values
        d_lo = face_deck["LowChord"].values
        ground_at_deck = _interp_ground_at(xs_df, d_sta)
        d_lo_clipped = np.maximum(d_lo, ground_at_deck)

        ax.fill_between(d_sta, d_lo_clipped, d_hi,
                        color="0.75", alpha=0.55, zorder=4, label="Deck")
        ax.plot(d_sta, d_hi, color="black", linewidth=1.5, zorder=5)

        # Low chord — only display where above ground
        lc_above = d_lo > ground_at_deck
        masked_lc = np.where(lc_above, d_lo, np.nan)
        ax.plot(d_sta, masked_lc, color="royalblue", linewidth=1.0, linestyle="--",
                zorder=5, label="Low Chord")

        # Bank station markers (opening limits from deck data)
        if len(opening_stations) >= 2:
            for bk_sta in [opening_stations.min(), opening_stations.max()]:
                ax.axvline(bk_sta, color="green", linewidth=0.8, linestyle=":",
                           alpha=0.6, zorder=2)
            ax.axvline(bk_sta, color="green", linewidth=0.8, linestyle=":",
                       alpha=0.6, zorder=2, label="Bank Sta")

        # Pier polygons — clip bottom at ground elevation
        first_pier = True
        for _, p in piers_df.iterrows():
            sta = p[pier_sta_col]
            widths = p[pier_w_col]
            elevs = p[pier_e_col]
            if not widths or not elevs:
                continue
            ground_at_pier = float(_interp_ground_at(xs_df, [sta])[0])
            clipped_elevs = [max(e, ground_at_pier) for e in elevs]

            left_edges = [sta - w / 2 for w in widths]
            right_edges = [sta + w / 2 for w in widths]
            poly_x = left_edges + right_edges[::-1]
            poly_y = clipped_elevs + clipped_elevs[::-1]
            ax.fill(poly_x, poly_y, color="dimgray", alpha=0.7, zorder=6,
                    edgecolor="black", linewidth=0.5,
                    label="Piers" if first_pier else None)
            first_pier = False

        # Fallback indicator
        source = xs_df["Source"].iloc[0]
        if source == "approach_xs":
            ax.text(0.5, 0.02, "(approach XS — no explicit bridge opening data)",
                    transform=ax.transAxes, ha="center", fontsize=7,
                    fontstyle="italic", color="0.45")

        ax.set_xlim(view_left, view_right)
        ax.set_title(title, fontsize=11)
        ax.set_xlabel("Station (ft)")
        ax.grid(True, alpha=0.25, zorder=0)
        ax.legend(fontsize=8, loc="upper right")

        vis_mask = (xs_sta >= view_left) & (xs_sta <= view_right)
        if vis_mask.any():
            elev_min_global = min(elev_min_global, xs_elev[vis_mask].min())
        elev_max_global = max(elev_max_global, d_hi.max())

    # Tighten y-axis around visible features
    if elev_min_global < elev_max_global:
        y_range = elev_max_global - elev_min_global
        for ax in axes:
            ax.set_ylim(elev_min_global - 0.05 * y_range, elev_max_global + 0.1 * y_range)

    axes[0].set_ylabel("Elevation (ft)")
    fig.tight_layout()
    return fig, axes
Plot the Bridge Hydraulics example bridge
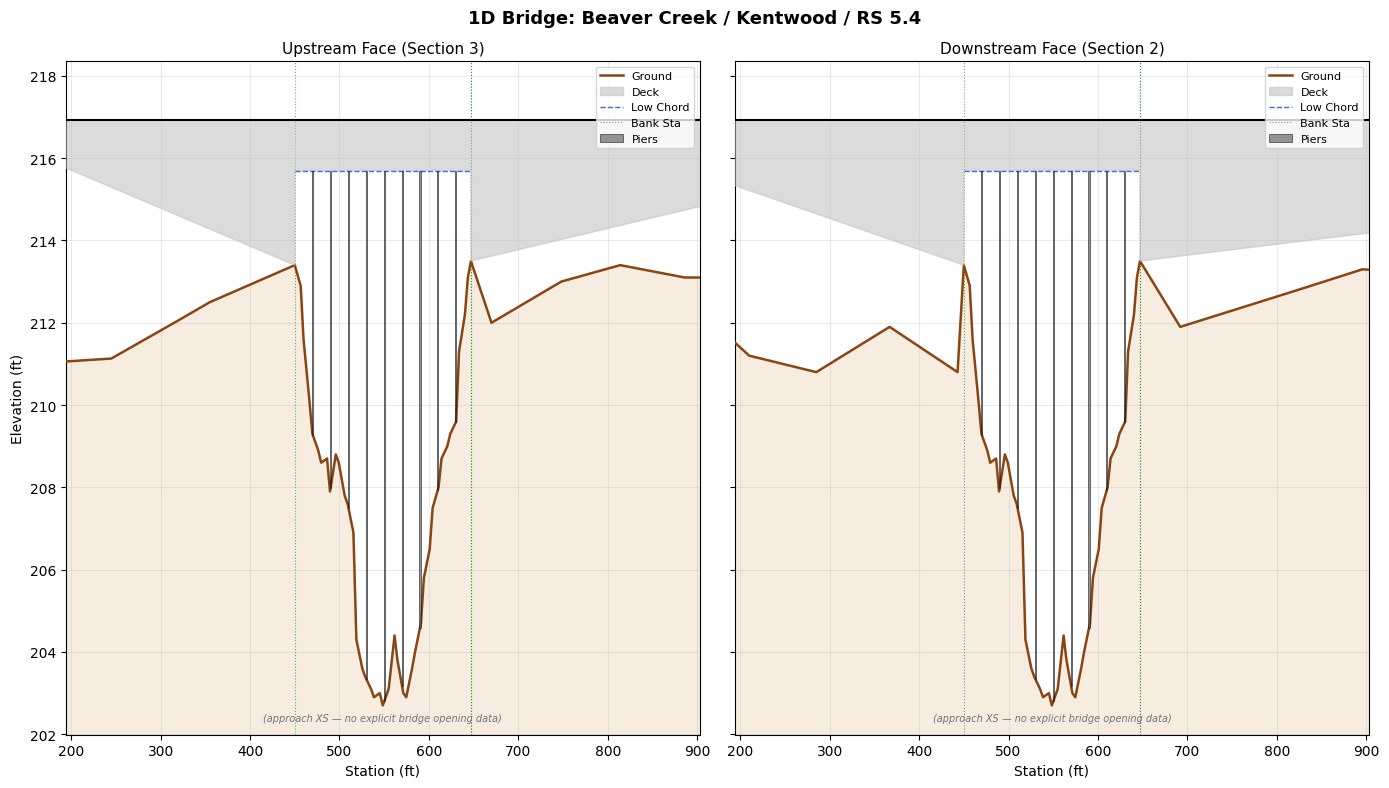
The Beaver Creek bridge at RS 5.4 has 9 piers spanning the channel opening between stations 450 and 647. The deck is at elevation 216.93 with a low chord of 215.7 in the channel and 200.0 on the overbanks (embankment fill).
fig, axes = plot_1d_bridge_xs(geom_file, river, reach, rs, channel_width_factor=1.8)
plt.savefig("219_beaver_creek_bridge.png", dpi=150, bbox_inches="tight")
plt.show()
2026-05-20 14:00:02 - ras_commander.geom.GeomBridge - INFO - Extracted deck geometry for Beaver Creek/Kentwood/RS 5.4: 6 points


2026-05-20 14:00:02 - ras_commander.geom.GeomBridge - INFO - Extracted 9 piers for Beaver Creek/Kentwood/RS 5.4


2026-05-20 14:00:02 - ras_commander.geom.GeomBridge - INFO - Extracted upstream bridge opening XS (66 pts) for Beaver Creek/Kentwood/RS 5.4 from adjacent approach XS


2026-05-20 14:00:02 - ras_commander.geom.GeomBridge - INFO - Extracted downstream bridge opening XS (63 pts) for Beaver Creek/Kentwood/RS 5.4 from adjacent approach XS
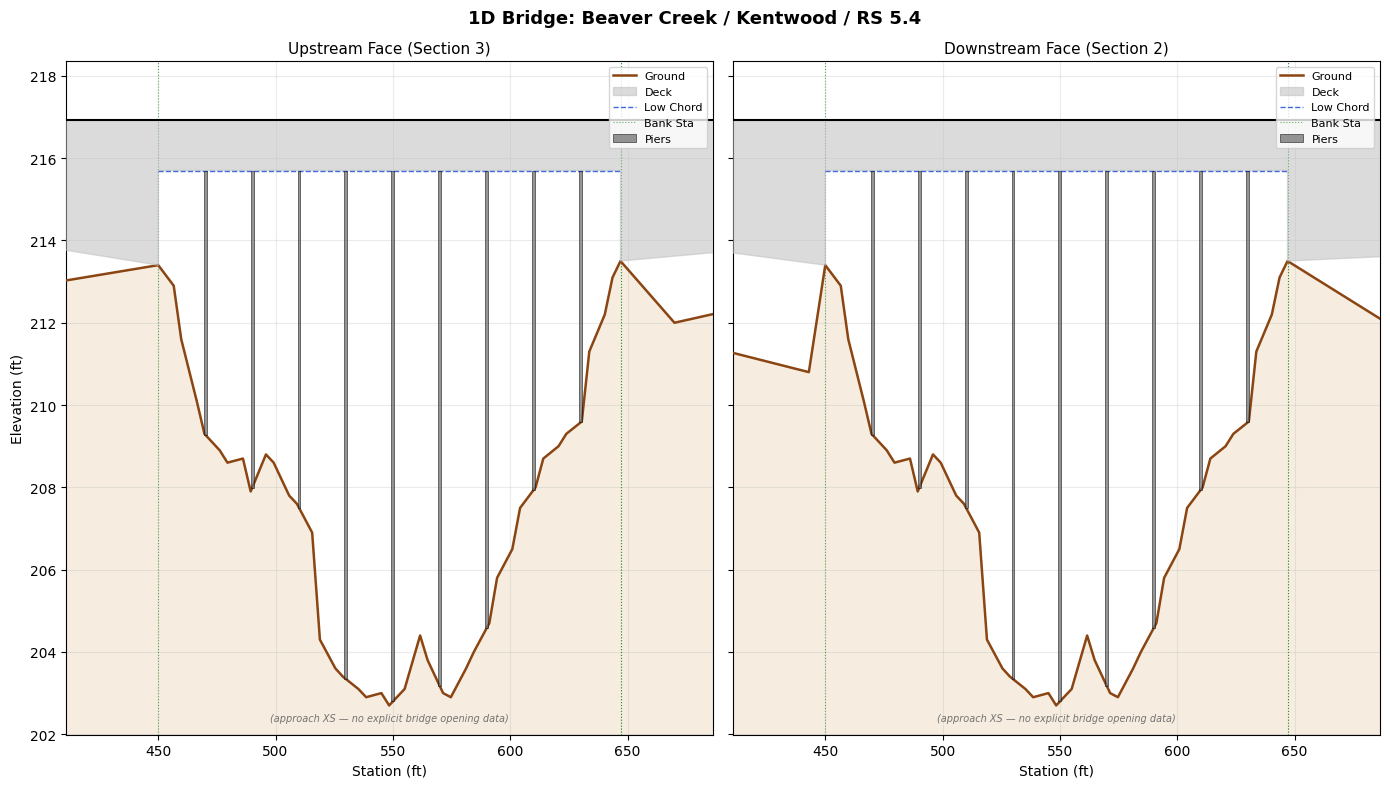
Zoomed view: channel opening only
Setting channel_width_factor=0.7 zooms in to just the bridge opening,
showing the pier spacing and low-chord clearance detail.
fig, axes = plot_1d_bridge_xs(geom_file, river, reach, rs, channel_width_factor=0.7)
plt.show()
2026-05-20 14:00:02 - ras_commander.geom.GeomBridge - INFO - Extracted deck geometry for Beaver Creek/Kentwood/RS 5.4: 6 points


2026-05-20 14:00:02 - ras_commander.geom.GeomBridge - INFO - Extracted 9 piers for Beaver Creek/Kentwood/RS 5.4


2026-05-20 14:00:02 - ras_commander.geom.GeomBridge - INFO - Extracted upstream bridge opening XS (66 pts) for Beaver Creek/Kentwood/RS 5.4 from adjacent approach XS


2026-05-20 14:00:02 - ras_commander.geom.GeomBridge - INFO - Extracted downstream bridge opening XS (63 pts) for Beaver Creek/Kentwood/RS 5.4 from adjacent approach XS
Data inspection
The tables below show the raw deck and pier geometry used in the plots.
print("Deck geometry:")
display(deck_df)

print(f"\nPier summary ({len(piers_df)} piers):")
pier_summary = piers_df[["PierIndex", "UpstreamStation", "DownstreamStation"]].copy()
pier_summary["Width (top)"] = piers_df["UpstreamWidths"].apply(lambda w: w[-1] if w else None)
pier_summary["Elev range"] = piers_df["UpstreamElevations"].apply(
    lambda e: f"{min(e):.1f}–{max(e):.1f}" if e else ""
)
display(pier_summary)
Deck geometry:
| Location | Station | Elevation | LowChord | |
|---|---|---|---|---|
| 0 | upstream | 0.0 | 216.93 | 200.0 |
| 1 | upstream | 450.0 | 216.93 | 200.0 |
| 2 | upstream | 450.0 | 216.93 | 215.7 |
| 3 | upstream | 647.0 | 216.93 | 215.7 |
| 4 | upstream | 647.0 | 216.93 | 200.0 |
| 5 | upstream | 2000.0 | 216.93 | 200.0 |
Pier summary (9 piers):
| PierIndex | UpstreamStation | DownstreamStation | Width (top) | Elev range | |
|---|---|---|---|---|---|
| 0 | 1 | 470.0 | 470.0 | 1.25 | 202.7–215.7 |
| 1 | 2 | 490.0 | 490.0 | 1.25 | 202.7–215.7 |
| 2 | 3 | 510.0 | 510.0 | 1.25 | 202.7–215.7 |
| 3 | 4 | 530.0 | 530.0 | 1.25 | 202.7–215.7 |
| 4 | 5 | 550.0 | 550.0 | 1.25 | 202.7–215.7 |
| 5 | 6 | 570.0 | 570.0 | 1.25 | 202.7–215.7 |
| 6 | 7 | 590.0 | 590.0 | 1.25 | 202.7–215.7 |
| 7 | 8 | 610.0 | 610.0 | 1.25 | 202.7–215.7 |
| 8 | 9 | 630.0 | 630.0 | 1.25 | 202.7–215.7 |