AORC Precipitation Catalog for HEC-RAS Rain-on-Grid Models
This notebook demonstrates a complete workflow for using NOAA's Analysis of Record for Calibration (AORC) gridded precipitation data with HEC-RAS 2D rain-on-grid models.
Example Project: BaldEagleCrkMulti2D
Workflow
- Extract example project and create a labeled working copy
- Get project bounds from geometry HDF (with buffer)
- Generate a storm catalog from historical AORC data
- Download precipitation, export hyetographs, and create HEC-RAS plans
- Execute all plans in parallel (2 cores, 3 workers)
- Extract and compare results
Data Export
All precipitation data is exported to the Precipitation/ subfolder:
- storm_catalog.csv - Complete storm catalog with metadata
- storm_YYYYMMDD.nc - NetCDF precipitation files
- hyetographs/ - PNG plots of each storm's precipitation
- storm_catalog_summary.png - Overview plot of all storms
AORC Dataset Overview
- Coverage: CONUS (1979-present), Alaska (1981-present)
- Resolution: ~800 meters, hourly timesteps
- Format: Cloud-optimized Zarr on AWS S3
- Access: Anonymous (no authentication required)
# Install dependencies (uncomment if needed)
# !pip install ras-commander[precip]  # Includes xarray, zarr, s3fs, netCDF4, rioxarray
# =============================================================================
# DEVELOPMENT MODE TOGGLE
# =============================================================================
USE_LOCAL_SOURCE = False  # <-- TOGGLE THIS

if USE_LOCAL_SOURCE:
    import sys
    from pathlib import Path
    local_path = str(Path.cwd().parent)
    if local_path not in sys.path:
        sys.path.insert(0, local_path)
    print(f"📁 LOCAL SOURCE MODE: Loading from {local_path}/ras_commander")
else:
    print("📦 PIP PACKAGE MODE: Loading installed ras-commander")

# Import ras-commander
from ras_commander import init_ras_project, RasExamples, RasPlan, RasUnsteady, RasCmdr, RasUtils
from ras_commander.precip import PrecipAorc
from ras_commander.hdf.HdfProject import HdfProject

# Additional imports
import os
import shutil
import glob
import pandas as pd
import numpy as np
import matplotlib.pyplot as plt
import xarray as xr

# Verify which version loaded
import ras_commander
print(f"✓ Loaded: {ras_commander.__file__}")
📦 PIP PACKAGE MODE: Loading installed ras-commander


✓ Loaded: <workspace>\ras_commander\__init__.py
Parameters
Configure these values to customize the notebook for your project.
# =============================================================================
# PARAMETERS - Edit these to customize the notebook
# =============================================================================
from pathlib import Path

# Project Configuration
PROJECT_NAME = "BaldEagleCrkMulti2D"  # Example project to extract
RAS_VERSION = "7.0"               # HEC-RAS version (6.3, 6.5, 6.6, etc.)
SUFFIX = "901"                    # Notebook identifier for project folder

# AORC Settings
ONLINE = True                     # Enable network requests

print(f"Project: {PROJECT_NAME}, Version: {RAS_VERSION}")
Project: BaldEagleCrkMulti2D, Version: 7.0
AORC Catalog Verification
After generating precipitation catalog:
- [ ] Storm events span simulation period + warmup time
- [ ] Total depths comparable to Atlas 14 estimates (within 20%)
- [ ] Inter-event separation prevents storm merging (8+ hours typical)
- [ ] Spatial coverage includes entire watershed (50% buffer minimum)
Data Quality Checks:
# Example: Compare catalog storms to Atlas 14
# (See NOAA Atlas 14: https://hdsc.nws.noaa.gov/hdsc/pfds/)
for storm in storm_catalog.iterrows():
    total_depth = storm['total_depth_in']
    duration = storm['duration_hours']
    # Compare to Atlas 14 for this duration/return period
    # Document if >20% different (grid vs point)
References: - NOAA Atlas 14: Precipitation-Frequency Atlas - AORC Documentation
Step 1: Extract Example Project and Create Working Copy
We extract the example project into a notebook-specific work root and create a labeled copy for our AORC analysis. Note: Existing notebook 901 AORC folders are removed with retry cleanup to ensure repeatability without touching notebook 900 worker folders.
# Configuration
YEAR = 2020  # Year to analyze
TEMPLATE_PLAN = "03"  # Template plan (2D 50ft Grid, uses g02.hdf geometry)
NUM_CORES = 2  # Cores per HEC-RAS instance
MAX_WORKERS = 3  # Parallel worker processes

# Keep this notebook isolated from notebook 900 parallel worker folders.
notebook_work_root = Path.cwd() / "working" / "example_projects_901_aorc_catalog"
notebook_work_root.mkdir(parents=True, exist_ok=True)
print(f"Notebook work root: {notebook_work_root}")

# Extract base example project into the notebook-specific work root.
base_project = RasExamples.extract_project(
    PROJECT_NAME,
    output_path=notebook_work_root,
    suffix=SUFFIX,
)
print(f"Base project extracted to: {base_project}")

# Clean up any existing AORC folders (for repeatability)
print("\nCleaning up existing AORC folders...")
aorc_pattern = f"{PROJECT_NAME}_AORC_*_{SUFFIX}*"
existing_folders = list(base_project.parent.glob(aorc_pattern))
removed_folders = 0
for folder in existing_folders:
    if folder.is_dir():
        print(f"  Removing: {folder.name}")
        if RasUtils.remove_with_retry(folder, ras_object=None):
            removed_folders += 1
        else:
            raise PermissionError(f"Unable to remove stale notebook 901 folder: {folder}")
print(f"  Removed {removed_folders} existing folders")

# Create labeled working copy (include SUFFIX for concurrent testing)
working_folder = base_project.parent / f"{PROJECT_NAME}_AORC_{YEAR}_{SUFFIX}"
print(f"\nCreating working copy: {working_folder}")
shutil.copytree(base_project, working_folder)

# Initialize project
ras = init_ras_project(working_folder, RAS_VERSION)
print(f"\nProject: {ras.project_name}")
print(f"Location: {ras.project_folder}")
print(f"Plans: {len(ras.plan_df)}")
Notebook work root: <workspace>\examples\working\example_projects_901_aorc_catalog


Base project extracted to: <workspace>\examples\working\example_projects_901_aorc_catalog\BaldEagleCrkMulti2D_901

Cleaning up existing AORC folders...
  Removed 0 existing folders

Creating working copy: <workspace>\examples\working\example_projects_901_aorc_catalog\BaldEagleCrkMulti2D_AORC_2020_901


Project: BaldEagleDamBrk
Location: <workspace>\examples\working\example_projects_901_aorc_catalog\BaldEagleCrkMulti2D_AORC_2020_901
Plans: 11
Step 2: Get Project Bounds from Geometry HDF
Use HdfProject.get_project_bounds_latlon() to extract proper bounds with buffering.
This handles CRS transformation and ensures precipitation coverage.
# Get geometry HDF path from template plan
# The 'Geom File' column contains just the number (e.g., "09"),
# so we need to add the "g" prefix for the geometry file extension
_matched = ras.plan_df[ras.plan_df['plan_number'] == TEMPLATE_PLAN]
if _matched.empty:
    available = ras.plan_df['plan_number'].tolist()
    raise ValueError(f"TEMPLATE_PLAN '{TEMPLATE_PLAN}' not found in project. "
                     f"Available plan numbers: {available}")
template_row = _matched.iloc[0]
geom_number = template_row['Geom File']
geom_hdf = ras.project_folder / f"{ras.project_name}.g{geom_number}.hdf"

print(f"Template plan {TEMPLATE_PLAN} uses geometry: g{geom_number}")
print(f"Geometry HDF: {geom_hdf}")
print(f"Exists: {geom_hdf.exists()}")

# Get bounds with 50% buffer (default)
# This properly handles CRS transformation and includes 2D mesh, 1D elements, and storage areas
bounds = HdfProject.get_project_bounds_latlon(
    geom_hdf,
    buffer_percent=50.0,  # 50% buffer ensures full coverage after reprojection
    include_1d=True,
    include_2d=True,
    include_storage=True
)

west, south, east, north = bounds
print(f"\nProject Bounds (WGS84 with 50% buffer):")
print(f"  West:  {west:.4f}")
print(f"  South: {south:.4f}")
print(f"  East:  {east:.4f}")
print(f"  North: {north:.4f}")
print(f"  Size:  {east-west:.4f} x {north-south:.4f} degrees")
Template plan 03 uses geometry: g09
Geometry HDF: <workspace>\examples\working\example_projects_901_aorc_catalog\BaldEagleCrkMulti2D_AORC_2020_901\BaldEagleDamBrk.g09.hdf
Exists: True

Project Bounds (WGS84 with 50% buffer):
  West:  -77.8672
  South: 40.9044
  East:  -77.2192
  North: 41.2408
  Size:  0.6480 x 0.3364 degrees
Step 3: Generate Storm Catalog
Analyze AORC data to identify all significant precipitation events for the year.
# Generate storm catalog
storm_catalog = PrecipAorc.get_storm_catalog(
    bounds=bounds,
    year=YEAR,
    inter_event_hours=8.0,      # USGS standard for storm separation
    min_depth_inches=0.75,      # Minimum significant precipitation
    buffer_hours=48             # Simulation warmup buffer
)

print(f"\nStorm Catalog: {len(storm_catalog)} events for {YEAR}")
print("="*90)
print(storm_catalog[['storm_id', 'start_time', 'end_time', 'total_depth_in',
                     'peak_intensity_in_hr', 'duration_hours', 'rank']].to_string(index=False))
Storm Catalog: 12 events for 2020
==========================================================================================
 storm_id          start_time            end_time  total_depth_in  peak_intensity_in_hr  duration_hours  rank
        1 2020-02-07 09:00:00 2020-02-07 17:00:00           1.023                 0.287               9     9
        2 2020-03-19 01:00:00 2020-03-19 10:00:00           0.763                 0.209              10    12
        3 2020-03-28 08:00:00 2020-03-29 11:00:00           1.530                 0.156              28     6
        4 2020-04-17 17:00:00 2020-04-18 08:00:00           0.777                 0.093              16    11
        5 2020-04-30 04:00:00 2020-05-01 00:00:00           2.115                 0.203              21     2
        6 2020-05-28 12:00:00 2020-05-30 01:00:00           1.188                 0.284              38     8
        7 2020-06-03 06:00:00 2020-06-03 22:00:00           0.846                 0.360              17    10
        8 2020-09-29 11:00:00 2020-09-30 08:00:00           1.278                 0.177              22     7
        9 2020-10-29 07:00:00 2020-10-30 18:00:00           1.735                 0.127              36     5
       10 2020-11-11 12:00:00 2020-11-11 22:00:00           1.989                 0.448              11     3
       11 2020-12-16 17:00:00 2020-12-17 09:00:00           1.834                 0.174              17     4
       12 2020-12-24 12:00:00 2020-12-25 12:00:00           2.720                 0.202              25     1
Step 4: Download AORC Data and Export Precipitation Records
Download precipitation data, export storm catalog CSV, and generate hyetograph plots for documentation.
# Create precipitation folder structure
precip_folder = ras.project_folder / "Precipitation"
precip_folder.mkdir(exist_ok=True)
hyetograph_folder = precip_folder / "hyetographs"
hyetograph_folder.mkdir(exist_ok=True)

# Export storm catalog to CSV
catalog_csv = precip_folder / "storm_catalog.csv"
storm_catalog.to_csv(catalog_csv, index=False)
print(f"Storm catalog exported to: {catalog_csv}")

# Download AORC data for all storms
print(f"\nDownloading AORC precipitation data for {len(storm_catalog)} storms...")
print("="*70)

precip_files = {}
for idx, storm in storm_catalog.iterrows():
    storm_id = storm['storm_id']
    date_str = storm['start_time'].strftime('%Y%m%d')
    precip_file = precip_folder / f"storm_{date_str}.nc"

    if not precip_file.exists():
        print(f"  Storm {storm_id:2d}: {storm['start_time'].strftime('%b %d')} - Downloading...")
        PrecipAorc.download(
            bounds=bounds,
            start_time=storm['sim_start'],
            end_time=storm['sim_end'],
            output_path=precip_file,
            target_crs="EPSG:5070",
            resolution=2000.0
        )
    else:
        print(f"  Storm {storm_id:2d}: {storm['start_time'].strftime('%b %d')} - Already downloaded")

    precip_files[storm_id] = precip_file

print(f"\nDownloaded {len(precip_files)} precipitation files to {precip_folder}")
Storm catalog exported to: <workspace>\examples\working\example_projects_901_aorc_catalog\BaldEagleCrkMulti2D_AORC_2020_901\Precipitation\storm_catalog.csv

Downloading AORC precipitation data for 12 storms...
======================================================================
  Storm  1: Feb 07 - Downloading...


  Storm  2: Mar 19 - Downloading...


  Storm  3: Mar 28 - Downloading...


  Storm  4: Apr 17 - Downloading...


  Storm  5: Apr 30 - Downloading...


  Storm  6: May 28 - Downloading...


  Storm  7: Jun 03 - Downloading...


  Storm  8: Sep 29 - Downloading...


  Storm  9: Oct 29 - Downloading...


  Storm 10: Nov 11 - Downloading...


  Storm 11: Dec 16 - Downloading...


  Storm 12: Dec 24 - Downloading...


Downloaded 12 precipitation files to <workspace>\examples\working\example_projects_901_aorc_catalog\BaldEagleCrkMulti2D_AORC_2020_901\Precipitation
# Generate and save individual hyetograph plots for each storm
print(f"Generating hyetograph plots for {len(storm_catalog)} storms...")
print("="*70)

for idx, storm in storm_catalog.iterrows():
    storm_id = storm['storm_id']
    date_str = storm['start_time'].strftime('%Y%m%d')
    precip_file = precip_files[storm_id]

    # Load precipitation data
    ds = xr.open_dataset(precip_file)
    da = ds['APCP_surface']
    hourly_mean = da.mean(dim=['x', 'y']).values
    times = pd.to_datetime(da.time.values)

    # Create figure
    fig, ax = plt.subplots(figsize=(12, 5))
    ax.bar(times, hourly_mean, width=0.03, color='steelblue', alpha=0.8, edgecolor='darkblue', linewidth=0.5)

    # Add storm info
    ax.set_title(f"Storm {storm_id}: {storm['start_time'].strftime('%B %d, %Y')}\n"
                 f"Total: {storm['total_depth_in']:.2f} in | Peak: {storm['peak_intensity_in_hr']:.3f} in/hr | "
                 f"Duration: {storm['duration_hours']:.0f} hours", fontsize=12, fontweight='bold')
    ax.set_xlabel('Date/Time', fontsize=11)
    ax.set_ylabel('Precipitation Rate (mm/hr)', fontsize=11)
    ax.tick_params(axis='x', rotation=45)
    ax.grid(True, alpha=0.3)

    # Add statistics box
    stats_text = (f"Max Rate: {hourly_mean.max():.2f} mm/hr\n"
                  f"Total: {hourly_mean.sum():.1f} mm\n"
                  f"Timesteps: {len(hourly_mean)}")
    ax.text(0.98, 0.95, stats_text, transform=ax.transAxes, fontsize=9,
            verticalalignment='top', horizontalalignment='right',
            bbox=dict(boxstyle='round', facecolor='wheat', alpha=0.8))

    plt.tight_layout()

    # Save plot
    plot_path = hyetograph_folder / f"storm_{date_str}_hyetograph.png"
    plt.savefig(plot_path, dpi=150, bbox_inches='tight')
    plt.close()

    ds.close()
    print(f"  Storm {storm_id:2d}: {storm['start_time'].strftime('%b %d')} - Saved to {plot_path.name}")

print(f"\nHyetographs saved to: {hyetograph_folder}")
Generating hyetograph plots for 12 storms...
======================================================================


  Storm  1: Feb 07 - Saved to storm_20200207_hyetograph.png


  Storm  2: Mar 19 - Saved to storm_20200319_hyetograph.png


  Storm  3: Mar 28 - Saved to storm_20200328_hyetograph.png


  Storm  4: Apr 17 - Saved to storm_20200417_hyetograph.png


  Storm  5: Apr 30 - Saved to storm_20200430_hyetograph.png


  Storm  6: May 28 - Saved to storm_20200528_hyetograph.png


  Storm  7: Jun 03 - Saved to storm_20200603_hyetograph.png


  Storm  8: Sep 29 - Saved to storm_20200929_hyetograph.png


  Storm  9: Oct 29 - Saved to storm_20201029_hyetograph.png


  Storm 10: Nov 11 - Saved to storm_20201111_hyetograph.png


  Storm 11: Dec 16 - Saved to storm_20201216_hyetograph.png


  Storm 12: Dec 24 - Saved to storm_20201224_hyetograph.png

Hyetographs saved to: <workspace>\examples\working\example_projects_901_aorc_catalog\BaldEagleCrkMulti2D_AORC_2020_901\Precipitation\hyetographs
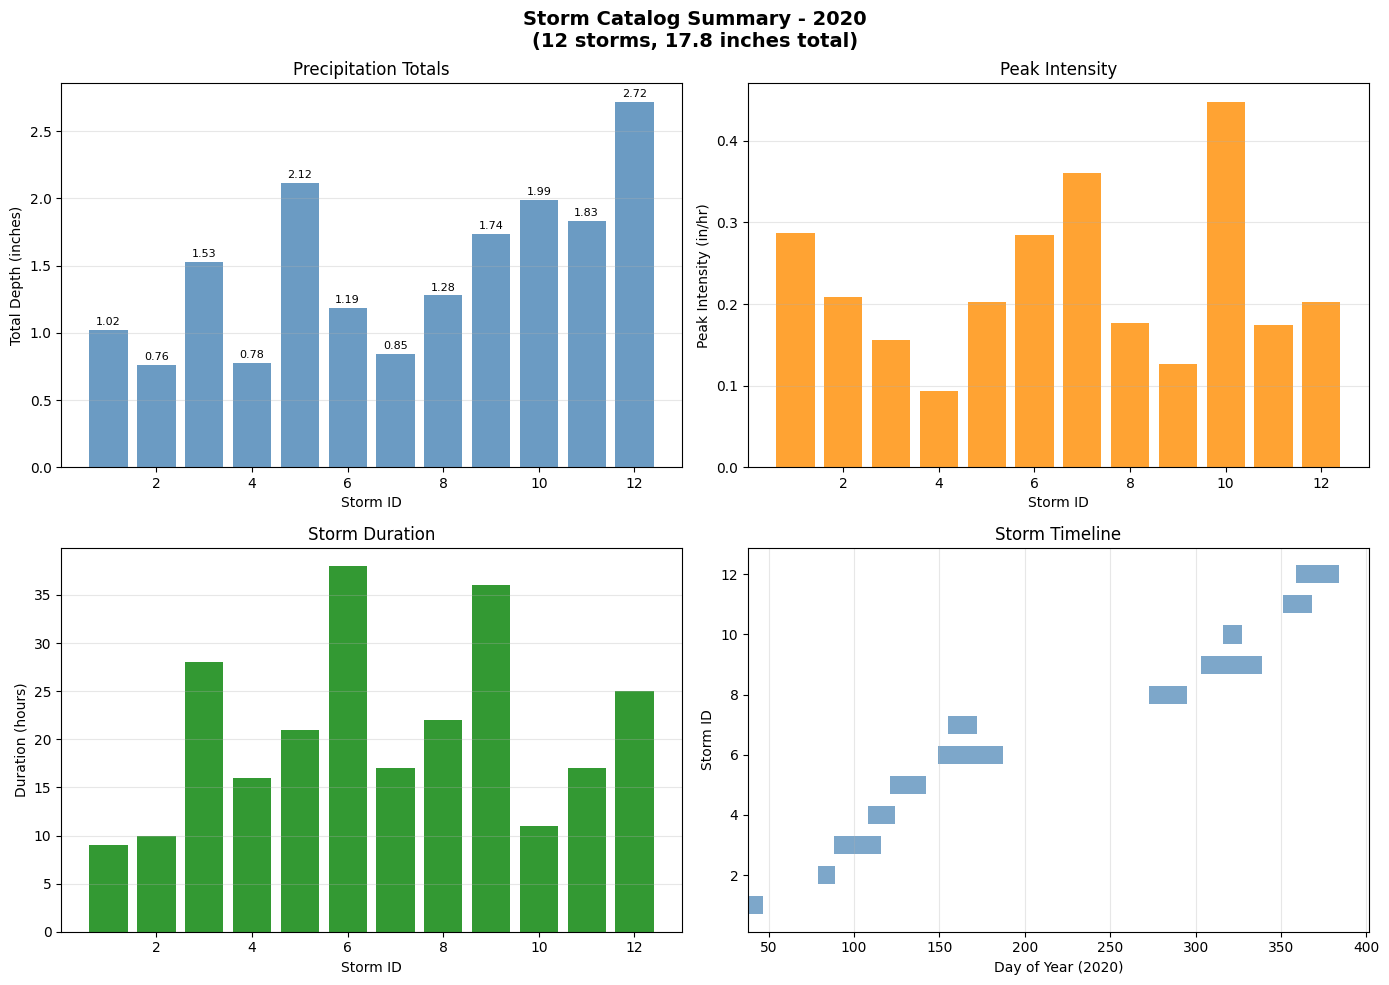
# Create storm catalog summary plot
fig, axes = plt.subplots(2, 2, figsize=(14, 10))

# 1. Total depth by storm
ax1 = axes[0, 0]
bars1 = ax1.bar(storm_catalog['storm_id'], storm_catalog['total_depth_in'], color='steelblue', alpha=0.8)
ax1.set_xlabel('Storm ID')
ax1.set_ylabel('Total Depth (inches)')
ax1.set_title('Precipitation Totals')
ax1.grid(True, alpha=0.3, axis='y')
# Add value labels
for bar, val in zip(bars1, storm_catalog['total_depth_in']):
    ax1.text(bar.get_x() + bar.get_width()/2, bar.get_height() + 0.02, f'{val:.2f}',
             ha='center', va='bottom', fontsize=8)

# 2. Peak intensity
ax2 = axes[0, 1]
bars2 = ax2.bar(storm_catalog['storm_id'], storm_catalog['peak_intensity_in_hr'], color='darkorange', alpha=0.8)
ax2.set_xlabel('Storm ID')
ax2.set_ylabel('Peak Intensity (in/hr)')
ax2.set_title('Peak Intensity')
ax2.grid(True, alpha=0.3, axis='y')

# 3. Duration
ax3 = axes[1, 0]
bars3 = ax3.bar(storm_catalog['storm_id'], storm_catalog['duration_hours'], color='green', alpha=0.8)
ax3.set_xlabel('Storm ID')
ax3.set_ylabel('Duration (hours)')
ax3.set_title('Storm Duration')
ax3.grid(True, alpha=0.3, axis='y')

# 4. Timeline
ax4 = axes[1, 1]
for idx, storm in storm_catalog.iterrows():
    ax4.barh(storm['storm_id'], storm['duration_hours'], left=storm['start_time'].dayofyear,
             color='steelblue', alpha=0.7, height=0.6)
ax4.set_xlabel(f'Day of Year ({YEAR})')
ax4.set_ylabel('Storm ID')
ax4.set_title('Storm Timeline')
ax4.grid(True, alpha=0.3, axis='x')

plt.suptitle(f'Storm Catalog Summary - {YEAR}\n({len(storm_catalog)} storms, '
             f'{storm_catalog["total_depth_in"].sum():.1f} inches total)',
             fontsize=14, fontweight='bold')
plt.tight_layout()

# Save summary plot
summary_path = precip_folder / "storm_catalog_summary.png"
plt.savefig(summary_path, dpi=150, bbox_inches='tight')
print(f"Summary plot saved to: {summary_path}")
plt.show()
Summary plot saved to: <workspace>\examples\working\example_projects_901_aorc_catalog\BaldEagleCrkMulti2D_AORC_2020_901\Precipitation\storm_catalog_summary.png
# Create storm plans with precipitation data written to HDF
print(f"Creating HEC-RAS plans for {len(storm_catalog)} storms...")
print("="*70)

# Use create_storm_plans which calls set_gridded_precipitation
# This writes precipitation data directly to the .u##.hdf file
results = PrecipAorc.create_storm_plans(
    storm_catalog=storm_catalog,
    bounds=bounds,
    template_plan=TEMPLATE_PLAN,
    precip_folder="Precipitation",
    ras_object=ras,
    download_data=False  # Already downloaded above
)

# Show results
print(f"\nPlan Creation Results:")
print(results[['storm_id', 'start_time', 'total_depth_in', 'plan_number', 'status']].to_string(index=False))

# Refresh plan list
ras.plan_df = ras.get_plan_entries()
print(f"\nTotal plans in project: {len(ras.plan_df)}")
Creating HEC-RAS plans for 12 storms...
======================================================================


Plan Creation Results:
 storm_id          start_time  total_depth_in plan_number  status
        1 2020-02-07 09:00:00           1.023          07 success
        2 2020-03-19 01:00:00           0.763          08 success
        3 2020-03-28 08:00:00           1.530          09 success
        4 2020-04-17 17:00:00           0.777          10 success
        5 2020-04-30 04:00:00           2.115          11 success
        6 2020-05-28 12:00:00           1.188          12 success
        7 2020-06-03 06:00:00           0.846          14 success
        8 2020-09-29 11:00:00           1.278          16 success
        9 2020-10-29 07:00:00           1.735          20 success
       10 2020-11-11 12:00:00           1.989          21 success
       11 2020-12-16 17:00:00           1.834          22 success
       12 2020-12-24 12:00:00           2.720          23 success

Total plans in project: 23
Step 5: Execute Storm Plans in Parallel
Run all storm plans using parallel execution with 2 cores per instance and 3 workers.
# Get list of storm plan numbers
storm_plan_numbers = results[results['status'] == 'success']['plan_number'].tolist()
print(f"Plans to execute: {storm_plan_numbers}")
print(f"Execution config: {NUM_CORES} cores x {MAX_WORKERS} workers")
print("="*70)
Plans to execute: ['07', '08', '09', '10', '11', '12', '14', '16', '20', '21', '22', '23']
Execution config: 2 cores x 3 workers
======================================================================
# Execute plans in parallel
import time

print(f"Starting parallel execution of {len(storm_plan_numbers)} plans...")
start_time = time.time()

execution_results = RasCmdr.compute_parallel(
    plan_number=storm_plan_numbers,
    max_workers=MAX_WORKERS,
    num_cores=NUM_CORES,
    ras_object=ras,
    overwrite_dest=True
)

elapsed = time.time() - start_time

# Results summary
success_count = sum(1 for success in execution_results.values() if success)
fail_count = len(execution_results) - success_count

print(f"\nExecution complete in {elapsed/60:.1f} minutes")
print(f"  Successful: {success_count}")
print(f"  Failed: {fail_count}")
print(f"\nResults copied to: {ras.project_folder.parent / (ras.project_folder.name + ' [Computed]')}")
Starting parallel execution of 12 plans...


Execution complete in 0.4 minutes
  Successful: 12
  Failed: 0

Results copied to: <workspace>\examples\working\example_projects_901_aorc_catalog\BaldEagleCrkMulti2D_AORC_2020_901 [Computed]
Step 6: Extract and Compare Results
Re-initialize from the computed folder and extract results summary.
# Results are already in original folder (v0.88.1+) - no re-initialization needed

# Extract results summary
import h5py
import pathlib

print("\nStorm Execution Results")
print("="*80)

storm_results = []
for idx, row in results[results['status'] == 'success'].iterrows():
    storm_id = row['storm_id']
    plan_num = row['plan_number']
    exec_success = execution_results.get(plan_num, False)

    plan_row = ras.plan_df[ras.plan_df['plan_number'] == plan_num]
    if len(plan_row) == 0:
        continue

    plan_path = pathlib.Path(plan_row.iloc[0]['full_path'])
    hdf_path = pathlib.Path(str(plan_path) + '.hdf')

    result = {
        'storm_id': storm_id,
        'plan_number': plan_num,
        'start_time': row['start_time'],
        'total_depth_in': row['total_depth_in'],
        'exec_success': exec_success,
        'hdf_exists': hdf_path.exists(),
        'hdf_size_mb': hdf_path.stat().st_size / 1e6 if hdf_path.exists() else 0
    }

    # Extract compute time if available
    if hdf_path.exists():
        try:
            with h5py.File(hdf_path, 'r') as f:
                if 'Results/Summary/Compute Processes' in f:
                    cp = f['Results/Summary/Compute Processes'][:]
                    if len(cp) > 0:
                        result['compute_time'] = cp[0]['Compute Time'].decode('utf-8').strip()
        except Exception:
            pass

    storm_results.append(result)
    status = 'OK' if exec_success and result['hdf_exists'] else 'FAILED'
    print(f"Storm {storm_id:2d} ({row['start_time'].strftime('%b %d')}): Plan {plan_num} - {status} - {result['hdf_size_mb']:.1f} MB")

print(f"\nCompleted: {sum(1 for r in storm_results if r['exec_success'])} of {len(storm_results)} storms")
Storm Execution Results
================================================================================
Storm  1 (Feb 07): Plan 07 - FAILED - 0.0 MB
Storm  2 (Mar 19): Plan 08 - FAILED - 0.0 MB
Storm  3 (Mar 28): Plan 09 - FAILED - 0.0 MB
Storm  4 (Apr 17): Plan 10 - FAILED - 0.0 MB
Storm  5 (Apr 30): Plan 11 - FAILED - 0.0 MB
Storm  6 (May 28): Plan 12 - FAILED - 0.0 MB
Storm  7 (Jun 03): Plan 14 - FAILED - 0.0 MB
Storm  8 (Sep 29): Plan 16 - FAILED - 0.0 MB
Storm  9 (Oct 29): Plan 20 - FAILED - 0.0 MB
Storm 10 (Nov 11): Plan 21 - FAILED - 0.0 MB
Storm 11 (Dec 16): Plan 22 - FAILED - 0.0 MB
Storm 12 (Dec 24): Plan 23 - FAILED - 0.0 MB

Completed: 12 of 12 storms
# Display results summary from results_df
# Shows execution status, completion, errors/warnings, and runtime for all plans
_summary_cols = ['plan_number', 'plan_title', 'completed', 'has_errors', 'has_warnings', 'runtime_complete_process_hours']
_avail = [c for c in _summary_cols if c in ras.results_df.columns]
ras.results_df[_avail]
| plan_number | plan_title | completed | has_errors | has_warnings | |
|---|---|---|---|---|---|
| 0 | 13 | PMF with Multi 2D Areas | False | False | False |
| 1 | 15 | 1d-2D Dambreak Refined Grid | False | False | False |
| 2 | 17 | 2D to 1D No Dam | False | False | False |
| 3 | 18 | 2D to 2D Run | False | False | False |
| 4 | 19 | SA to 2D Dam Break Run | False | False | False |
| 5 | 03 | Single 2D Area - Internal Dam Structure | False | False | False |
| 6 | 04 | SA to 2D Area Conn - 2D Levee Structure | False | False | False |
| 7 | 02 | SA to Detailed 2D Breach | False | False | False |
| 8 | 01 | SA to Detailed 2D Breach FEQ | False | False | False |
| 9 | 05 | Single 2D area with Bridges FEQ | False | False | False |
| 10 | 06 | Gridded Precip - Infiltration | False | False | False |
| 11 | 07 | AORC Storm Feb 07, 2020 | False | False | False |
| 12 | 08 | AORC Storm Mar 19, 2020 | False | False | False |
| 13 | 09 | AORC Storm Mar 28, 2020 | False | False | False |
| 14 | 10 | AORC Storm Apr 17, 2020 | False | False | False |
| 15 | 11 | AORC Storm Apr 30, 2020 | False | False | False |
| 16 | 12 | AORC Storm May 28, 2020 | False | False | False |
| 17 | 14 | AORC Storm Jun 03, 2020 | False | False | False |
| 18 | 16 | AORC Storm Sep 29, 2020 | False | False | False |
| 19 | 20 | AORC Storm Oct 29, 2020 | False | False | False |
| 20 | 21 | AORC Storm Nov 11, 2020 | False | False | False |
| 21 | 22 | AORC Storm Dec 16, 2020 | False | False | False |
| 22 | 23 | AORC Storm Dec 24, 2020 | False | False | False |
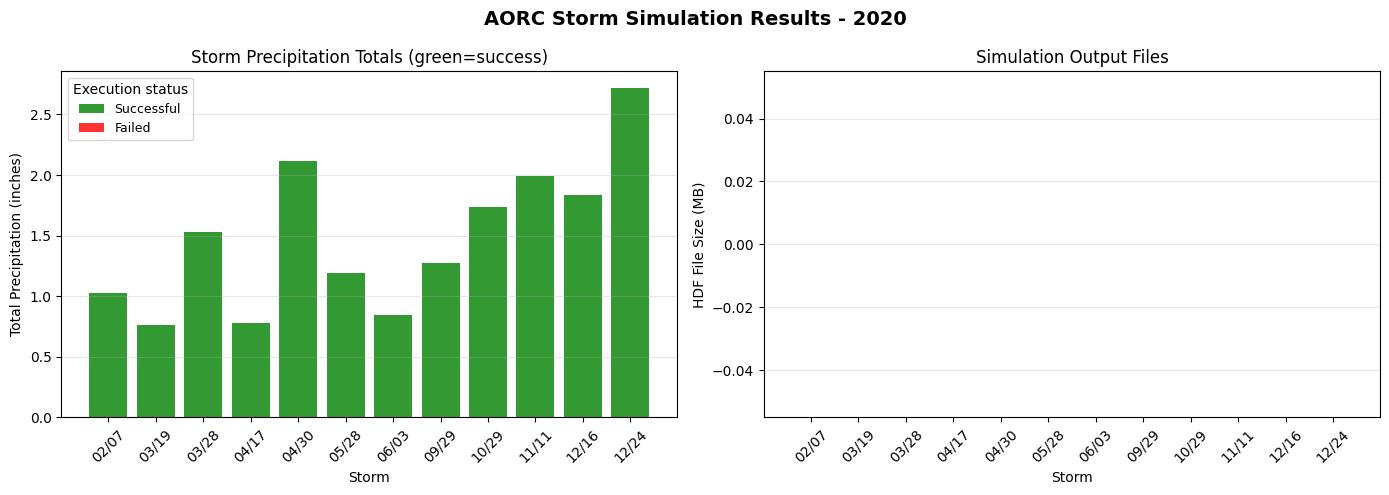
# Summary visualization
if storm_results:
    fig, axes = plt.subplots(1, 2, figsize=(14, 5))

    # Precipitation totals
    ax1 = axes[0]
    storm_dates = [r['start_time'].strftime('%m/%d') for r in storm_results]
    precip_totals = [r['total_depth_in'] for r in storm_results]
    colors = ['green' if r['exec_success'] else 'red' for r in storm_results]
    from matplotlib.patches import Patch
    status_legend = [
        Patch(facecolor='green', alpha=0.8, label='Successful'),
        Patch(facecolor='red', alpha=0.8, label='Failed'),
    ]

    bars = ax1.bar(range(len(storm_results)), precip_totals, color=colors, alpha=0.8)
    ax1.set_xlabel('Storm')
    ax1.set_ylabel('Total Precipitation (inches)')
    ax1.set_title('Storm Precipitation Totals (green=success)')
    ax1.set_xticks(range(len(storm_results)))
    ax1.set_xticklabels(storm_dates, rotation=45)
    ax1.legend(handles=status_legend, title='Execution status', fontsize=9)
    ax1.grid(True, alpha=0.3, axis='y')

    # HDF sizes
    ax2 = axes[1]
    hdf_sizes = [r['hdf_size_mb'] for r in storm_results]
    ax2.bar(range(len(storm_results)), hdf_sizes, color=colors, alpha=0.8)
    ax2.set_xlabel('Storm')
    ax2.set_ylabel('HDF File Size (MB)')
    ax2.set_title('Simulation Output Files')
    ax2.set_xticks(range(len(storm_results)))
    ax2.set_xticklabels(storm_dates, rotation=45)
    ax2.grid(True, alpha=0.3, axis='y')

    plt.suptitle(f'AORC Storm Simulation Results - {YEAR}', fontsize=14, fontweight='bold')
    plt.tight_layout()
    plt.show()
Data Export Summary
All precipitation data has been exported to the project's Precipitation/ folder:
# List all exported files
print(f"Precipitation Data Export Summary")
print(f"Location: {precip_folder}")
print("="*70)

# Count files
nc_files = list(precip_folder.glob("storm_*.nc"))
png_files = list(hyetograph_folder.glob("*.png"))
csv_files = list(precip_folder.glob("*.csv"))
summary_files = list(precip_folder.glob("storm_catalog_summary.png"))

print(f"\nExported Files:")
print(f"  Storm Catalog CSV:    {len(csv_files)} file(s)")
print(f"  NetCDF Precip Files:  {len(nc_files)} file(s)")
print(f"  Hyetograph PNGs:      {len(png_files)} file(s)")
print(f"  Summary Plot:         {len(summary_files)} file(s)")

# Calculate total size
total_size = sum(f.stat().st_size for f in nc_files + png_files + csv_files + summary_files)
print(f"\nTotal Size: {total_size / 1e6:.1f} MB")

print(f"\nFolder Structure:")
print(f"  Precipitation/")
print(f"    storm_catalog.csv")
print(f"    storm_catalog_summary.png")
print(f"    storm_YYYYMMDD.nc  (x{len(nc_files)})")
print(f"    hyetographs/")
print(f"      storm_YYYYMMDD_hyetograph.png  (x{len(png_files)})")
Precipitation Data Export Summary
Location: <workspace>\examples\working\example_projects_901_aorc_catalog\BaldEagleCrkMulti2D_AORC_2020_901\Precipitation
======================================================================

Exported Files:
  Storm Catalog CSV:    1 file(s)
  NetCDF Precip Files:  12 file(s)
  Hyetograph PNGs:      12 file(s)
  Summary Plot:         1 file(s)

Total Size: 3.4 MB

Folder Structure:
  Precipitation/
    storm_catalog.csv
    storm_catalog_summary.png
    storm_YYYYMMDD.nc  (x12)
    hyetographs/
      storm_YYYYMMDD_hyetograph.png  (x12)
Summary
This notebook demonstrated a complete AORC precipitation workflow:
- Project Setup - Extracted example and created labeled working copy (with cleanup)
- Bounds Calculation - Used
HdfProject.get_project_bounds_latlon()with 50% buffer - Storm Catalog - Generated catalog using USGS standard parameters
- Precipitation Export - Downloaded AORC data, exported CSV catalog and hyetograph plots
- Plan Creation - Created HEC-RAS plans with precipitation written to HDF
- Parallel Execution - Ran all plans with 2 cores and 3 workers
Key Functions
| Function | Description |
|---|---|
HdfProject.get_project_bounds_latlon() |
Get buffered bounds from geometry HDF |
PrecipAorc.get_storm_catalog() |
Generate catalog of precipitation events |
PrecipAorc.download() |
Download AORC data to NetCDF |
PrecipAorc.create_storm_plans() |
Create plans with precipitation in HDF |
RasCmdr.compute_parallel() |
Execute plans in parallel |
Optional: Process All Available AORC Years (1979-2024)
The following cell processes storm catalogs for all available years in the AORC dataset. Each year gets its own project folder with full precipitation data export.
Warning: This can take a very long time and generate many files!
# OPTIONAL: Process all AORC years
# Set PROCESS_ALL_YEARS = True to run

PROCESS_ALL_YEARS = False  # Set to True to run

if PROCESS_ALL_YEARS:
    import time

    # AORC is available from 1979-present for CONUS
    ALL_YEARS = list(range(1979, 2025))  # 1979-2024

    print(f"Processing {len(ALL_YEARS)} years of AORC data")
    print(f"Configuration: {NUM_CORES} cores x {MAX_WORKERS} workers per year")
    print("="*80)

    # Clean up this notebook's existing AORC folders first
    print("\nCleaning up existing AORC folders...")
    existing_folders = list(base_project.parent.glob(f"{PROJECT_NAME}_AORC_*_{SUFFIX}*"))
    removed_folders = 0
    for folder in existing_folders:
        if folder.is_dir():
            print(f"  Removing: {folder.name}")
            if RasUtils.remove_with_retry(folder, ras_object=None):
                removed_folders += 1
            else:
                raise PermissionError(f"Unable to remove stale notebook 901 folder: {folder}")
    print(f"  Removed {removed_folders} existing folders")

    all_year_results = {}

    for year in ALL_YEARS:
        try:
            print(f"\n{'='*80}")
            print(f"PROCESSING YEAR: {year}")
            print(f"{'='*80}")

            # Create year-specific working folder
            year_folder = base_project.parent / f"{PROJECT_NAME}_AORC_{year}_{SUFFIX}"
            print(f"  Creating: {year_folder.name}")
            shutil.copytree(base_project, year_folder)

            # Initialize
            ras_year = init_ras_project(year_folder, RAS_VERSION)

            # Generate storm catalog
            print(f"  Generating storm catalog for {year}...")
            catalog = PrecipAorc.get_storm_catalog(
                bounds=bounds,
                year=year,
                inter_event_hours=8.0,
                min_depth_inches=0.75,
                buffer_hours=48
            )
            print(f"  Found {len(catalog)} storms")

            if len(catalog) == 0:
                print(f"  No storms found for {year}, skipping")
                all_year_results[year] = {'storms': 0, 'plans': 0, 'success': 0, 'elapsed_min': 0}
                continue

            # Create precipitation folder structure
            year_precip_folder = year_folder / "Precipitation"
            year_precip_folder.mkdir(exist_ok=True)
            year_hyetograph_folder = year_precip_folder / "hyetographs"
            year_hyetograph_folder.mkdir(exist_ok=True)

            # Export storm catalog to CSV
            catalog.to_csv(year_precip_folder / "storm_catalog.csv", index=False)
            print(f"  Exported storm catalog CSV")

            # Download precipitation and create plans
            print(f"  Downloading precipitation and creating plans...")
            year_plan_results = PrecipAorc.create_storm_plans(
                storm_catalog=catalog,
                bounds=bounds,
                template_plan=TEMPLATE_PLAN,
                precip_folder="Precipitation",
                ras_object=ras_year,
                download_data=True
            )

            # Generate hyetographs for each storm
            print(f"  Generating hyetograph plots...")
            for idx, storm in catalog.iterrows():
                storm_id = storm['storm_id']
                date_str = storm['start_time'].strftime('%Y%m%d')
                precip_file = year_precip_folder / f"storm_{date_str}.nc"

                if precip_file.exists():
                    ds = xr.open_dataset(precip_file)
                    da = ds['APCP_surface']
                    hourly_mean = da.mean(dim=['x', 'y']).values
                    times = pd.to_datetime(da.time.values)

                    fig, ax = plt.subplots(figsize=(12, 5))
                    ax.bar(times, hourly_mean, width=0.03, color='steelblue', alpha=0.8)
                    ax.set_title(f"Storm {storm_id}: {storm['start_time'].strftime('%B %d, %Y')}\n"
                                 f"Total: {storm['total_depth_in']:.2f} in | Peak: {storm['peak_intensity_in_hr']:.3f} in/hr",
                                 fontsize=12, fontweight='bold')
                    ax.set_xlabel('Date/Time')
                    ax.set_ylabel('Precipitation Rate (mm/hr)')
                    ax.tick_params(axis='x', rotation=45)
                    ax.grid(True, alpha=0.3)
                    plt.tight_layout()
                    plt.savefig(year_hyetograph_folder / f"storm_{date_str}_hyetograph.png", dpi=150, bbox_inches='tight')
                    plt.close()
                    ds.close()

            # Create summary plot
            fig, axes = plt.subplots(1, 3, figsize=(15, 4))
            axes[0].bar(catalog['storm_id'], catalog['total_depth_in'], color='steelblue', alpha=0.8)
            axes[0].set_xlabel('Storm ID')
            axes[0].set_ylabel('Total Depth (in)')
            axes[0].set_title('Precipitation Totals')
            axes[1].bar(catalog['storm_id'], catalog['peak_intensity_in_hr'], color='darkorange', alpha=0.8)
            axes[1].set_xlabel('Storm ID')
            axes[1].set_ylabel('Peak Intensity (in/hr)')
            axes[1].set_title('Peak Intensity')
            axes[2].bar(catalog['storm_id'], catalog['duration_hours'], color='green', alpha=0.8)
            axes[2].set_xlabel('Storm ID')
            axes[2].set_ylabel('Duration (hours)')
            axes[2].set_title('Storm Duration')
            plt.suptitle(f'Storm Catalog Summary - {year}', fontsize=14, fontweight='bold')
            plt.tight_layout()
            plt.savefig(year_precip_folder / "storm_catalog_summary.png", dpi=150, bbox_inches='tight')
            plt.close()

            # Get plan numbers and execute
            plan_numbers = year_plan_results[year_plan_results['status'] == 'success']['plan_number'].tolist()
            print(f"  Created {len(plan_numbers)} plans")

            if len(plan_numbers) == 0:
                print(f"  No successful plans for {year}, skipping execution")
                all_year_results[year] = {'storms': len(catalog), 'plans': 0, 'success': 0, 'elapsed_min': 0}
                continue

            # Execute in parallel
            print(f"  Executing {len(plan_numbers)} plans ({NUM_CORES} cores x {MAX_WORKERS} workers)...")
            start_time = time.time()

            exec_results = RasCmdr.compute_parallel(
                plan_number=plan_numbers,
                max_workers=MAX_WORKERS,
                num_cores=NUM_CORES,
                ras_object=ras_year,
                overwrite_dest=True
            )

            elapsed = time.time() - start_time
            success = sum(1 for v in exec_results.values() if v)

            all_year_results[year] = {
                'storms': len(catalog),
                'plans': len(plan_numbers),
                'success': success,
                'elapsed_min': elapsed / 60
            }

            print(f"  Completed: {success}/{len(plan_numbers)} in {elapsed/60:.1f} minutes")

        except Exception as e:
            print(f"  ERROR processing {year}: {e}")
            all_year_results[year] = {'error': str(e)}

    # Final summary
    print("\n" + "="*80)
    print("ALL YEARS SUMMARY")
    print("="*80)

    total_storms = 0
    total_success = 0
    for year, res in sorted(all_year_results.items()):
        if 'error' in res:
            print(f"{year}: ERROR - {res['error']}")
        else:
            total_storms += res['storms']
            total_success += res['success']
            print(f"{year}: {res['storms']} storms, {res['success']}/{res['plans']} success, {res['elapsed_min']:.1f} min")

    print(f"\nTOTAL: {total_storms} storms, {total_success} successful simulations")
else:
    print("Set PROCESS_ALL_YEARS = True to process all AORC years (1979-2024)")
    print("Warning: This will take many hours and create ~50 project folders!")
    print("\nEach year will include:")
    print("  - Precipitation/storm_catalog.csv")
    print("  - Precipitation/storm_catalog_summary.png")
    print("  - Precipitation/storm_YYYYMMDD.nc (per storm)")
    print("  - Precipitation/hyetographs/storm_YYYYMMDD_hyetograph.png (per storm)")
Set PROCESS_ALL_YEARS = True to process all AORC years (1979-2024)
Warning: This will take many hours and create ~50 project folders!

Each year will include:
  - Precipitation/storm_catalog.csv
  - Precipitation/storm_catalog_summary.png
  - Precipitation/storm_YYYYMMDD.nc (per storm)
  - Precipitation/hyetographs/storm_YYYYMMDD_hyetograph.png (per storm)